Since version 4.0, the .NET Framework has included an in-memory cache in the form of the class System.Runtime.Caching.MemoryCache. The MemoryCache provides a simple API to cache any data during the runtime of the application in the form of key-value pairs.
If performance problems occur during the execution of the application, it may be helpful to analyze the behavior of the memory cache in detail. More or less intelligent methods are available, such as logging, ETW traces, memory dumps, and so on.
What many do not know, System.Runtime.Caching.MemoryCache can provide the most important key figures via Performance Counters. The corresponding performance counters are generated in MemoryCache::InitDisposableMembers and registered in PerfCounters::InitDisposableMembers with the following values:
namespace System.Runtime.Caching {
    internal enum PerfCounterName {
        Entries = 0,
        Hits,
        HitRatio,
        HitRatioBase,
        Misses,
        Trims,
        Turnover
    }
}
The following C# program serves as an example
namespace MemoryCachePerformanceCounters
{
    class MyData { }
    class Program
    {
        static void Main(string[] args)
        {
            var cache = new MemoryCache("DEMOCACHE");

            Console.WriteLine("press <Enter> to start");
            Console.ReadLine();

            object data = cache.Get("cachekey_1");

            cache.Add("cachekey_1", new MyData(), DateTimeOffset.UtcNow.AddHours(1));

            data = cache.Get("cachekey_1");

            cache.Remove("cachekey_1");

            Console.WriteLine("finished!");
        }
    }
}
The available performance counters are stored under the category .NET Memory Cache 4.0 and can be queried with typeperf. We write the relevant performance counters to the file mycounters.txt so that we can execute a trace later. With -qx only the performance counters with instances are displayed, this requires that the application is already running. We also filter the output to the string democache.
$ typeperf -qx ".NET Memory Cache 4.0" | findstr "democache" > mycounters.txt
mycounters.txt now contains the following performance counters:
\.NET Memory Cache 4.0(memorycacheperformancecounters:democache)\Cache Hits
\.NET Memory Cache 4.0(memorycacheperformancecounters:democache)\Cache Misses
\.NET Memory Cache 4.0(memorycacheperformancecounters:democache)\Cache Hit Ratio
\.NET Memory Cache 4.0(memorycacheperformancecounters:democache)\Cache Trims
\.NET Memory Cache 4.0(memorycacheperformancecounters:democache)\Cache Entries
\.NET Memory Cache 4.0(memorycacheperformancecounters:democache)\Cache Turnover Rate
Note: If typeperf generates an error like “Error: No valid counters”, the category has to be activated with lodctr first. Open cmd as admin and execute following command:
$ cd C:\Windows\INF\".NET Memory Cache 4.0"
$ lodctr netmemorycache.ini
As soon as the sample application is started, we can read the performance counters:
$ typeperf -cf mycounters.txt -f TSV -o result.tsv -si 1
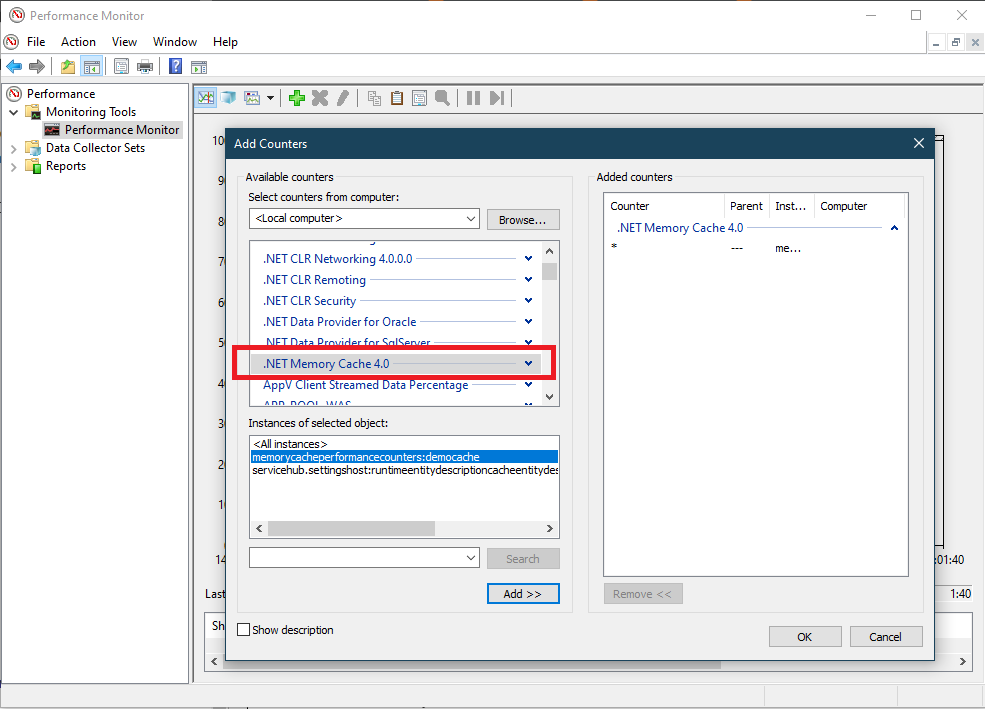
With -si 1 every second the values of the performance counters are read out and written into the file result.tsv, CTRL+C ends the process. Instead of working with typeperf, you can also use the Windows Performance Monitor (perfmon.exe) which provides a nice UI for selecting the necessary performance counters.
Note: Performance Counters are not available in .NET Core. So the Example above, only works with the full .NET Framework (4 and above)